
Measured Findings
Deployment records, public camera mapping, activity volumes, and a privacy-safe local error laboratory—with every denominator and limitation visible.
The figures below answer different questions. They must not be collapsed into one count. An Atlas row is not a camera; a detection is not a unique driver; a hot-list hit is not an arrest or solved crime.
Footprint
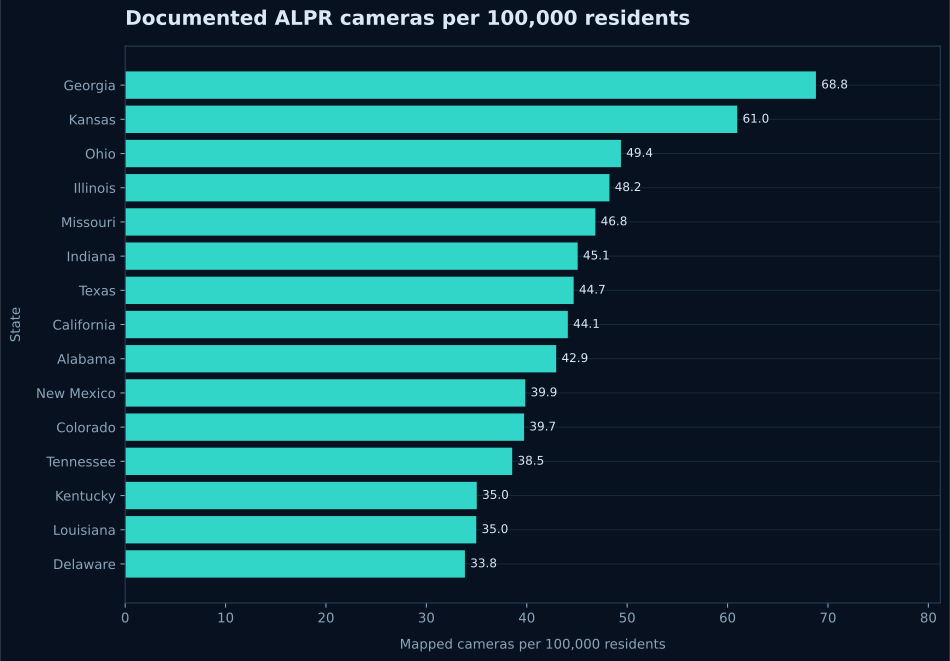 Figure 1 · Eyes Off Indiana / OpenStreetMap-derived state rankings, retrieved 2026-07-13. The 113,963 mapped cameras are a lower-bound public census, not a complete installed inventory.
The fifty-state rankings file contains 113,963 publicly mapped cameras, or 33.6 per 100,000 residents using the source's population denominators. Volunteer mapping and public-record coverage are uneven, so state differences may reflect both real deployment and documentation intensity.
Vendor fields in documented adoption records
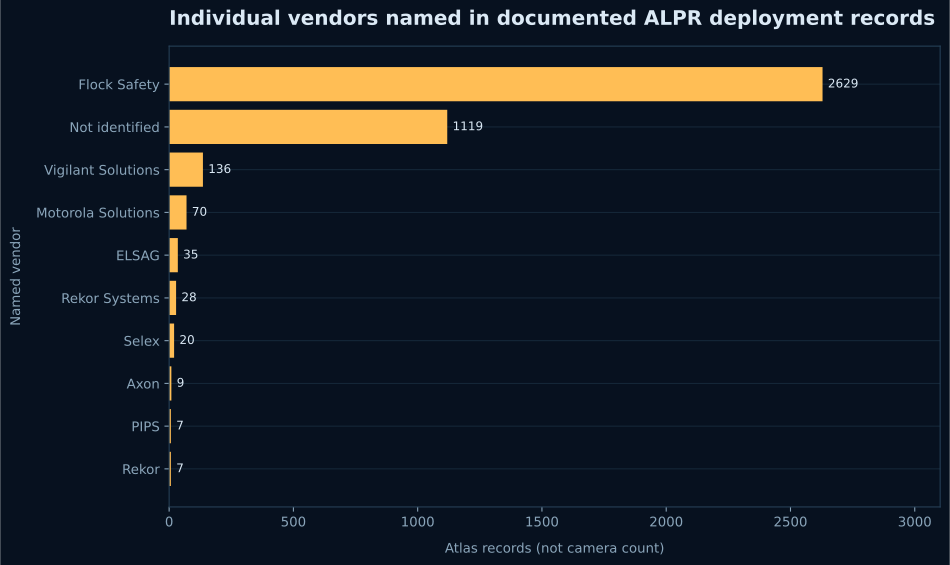 Figure 2 · Vendor fields among EFF Atlas records classified as Automated License Plate Readers. Records may name no vendor or multiple products.
The Atlas snapshot contains 4,084 ALPR records. Flock Safety appears in 2,629, or 64.4%. This describes vendor representation in a sourced agency-technology inventory. It is not camera market share.
Public documentation growth
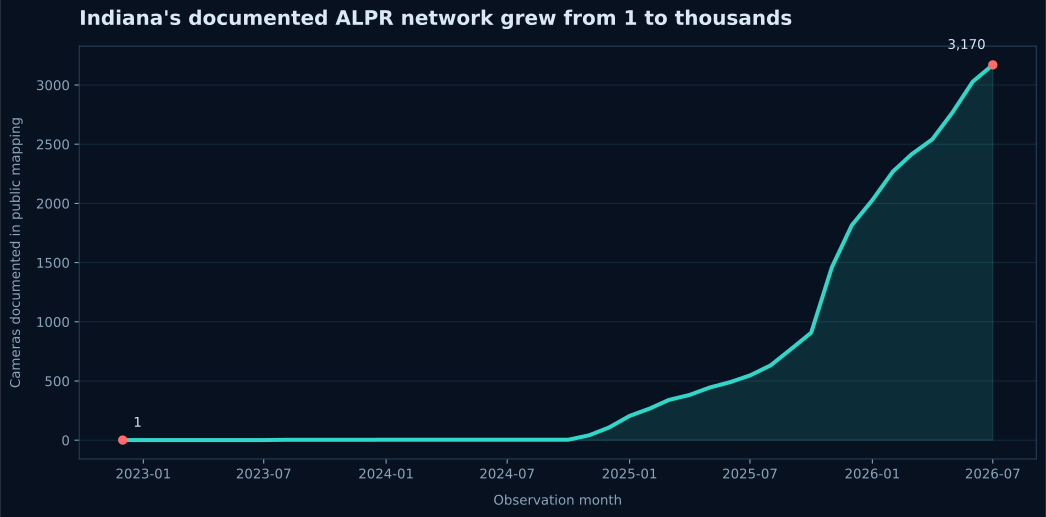 Figure 3 · Eyes Off Indiana monthly public mapping series. Growth is in documented cameras; the series does not prove every camera's installation date.
Indiana's public series increased from 1 mapped camera in December 2022 to 3,170 in July 2026. A separate portal sample covering 18 Indiana agencies reported 189 cameras and 3,920,631 detections over 30 days—about 691.5 detections per camera per day.
Capture volume versus recorded hits
 Figure 4 · EFF California 2021–2022 detections-and-hits file. “No hit” does not mean “innocent” or “never used later”; “hit” does not mean “correct, arrested, or convicted.”
Agencies reported 3,224,074,784 detections and 3,556,754 hits, a 0.110% hit share. The ratio establishes that the infrastructure records far more observations than it flags at capture time. It does not supply positive predictive value at the point of police action because outcome linkage is absent.
Synthetic OCR degradation
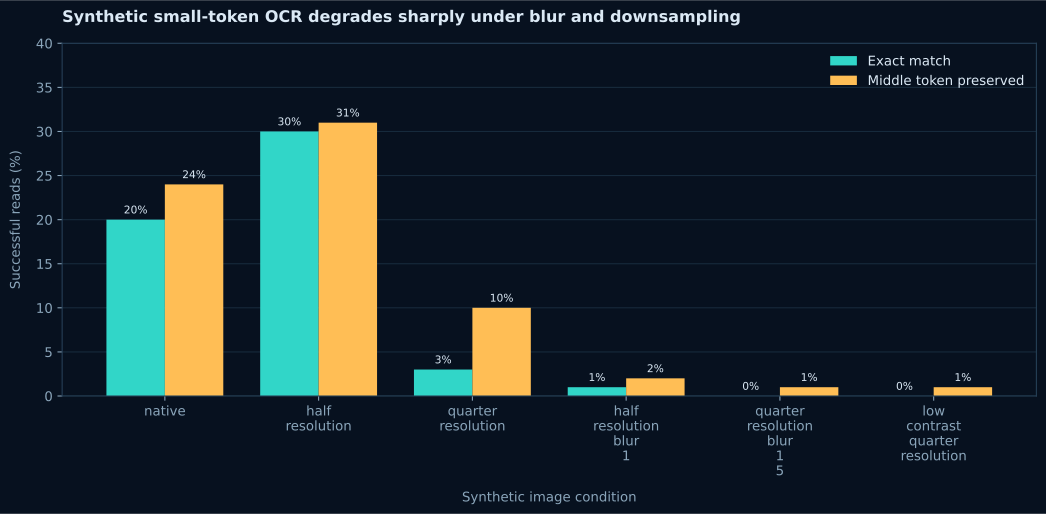 Figure 5 · Fast Plate OCR 1.1.0 on 100 fictional identifiers × 6 conditions, local CPU. Open-model synthetic benchmark; not a Flock Safety accuracy estimate.
The unusual small-token layout was deliberately difficult. The open model preserved the middle token in 24% of native images, 10% at quarter resolution, and 1% under blurred or low-contrast quarter resolution. Non-monotonic native/half-resolution performance shows the stimuli are out of distribution; only the controlled failure mechanism is in scope.
What these findings establish
- ALPR infrastructure is publicly documented at substantial scale.
- Flock is strongly represented in one national adoption inventory.
- Public activity files show billions of detections and sparse contemporaneous hot-list hits.
- Modest local networks can generate millions of observations each month.
- Deleting a distinguishing token creates database ambiguity.
- An open OCR model can lose that token under controlled degradation.
They do not establish a national false-positive rate, Flock's proprietary accuracy, causal crime reduction, or how often a documented failure occurs.